Track Support Metrics in Reports and Build Your Own Dashboards
See how many conversations arrive, how fast your team replies and closes them, how customers rate your replies, and when you are busiest. Put the charts you use most on one dashboard.
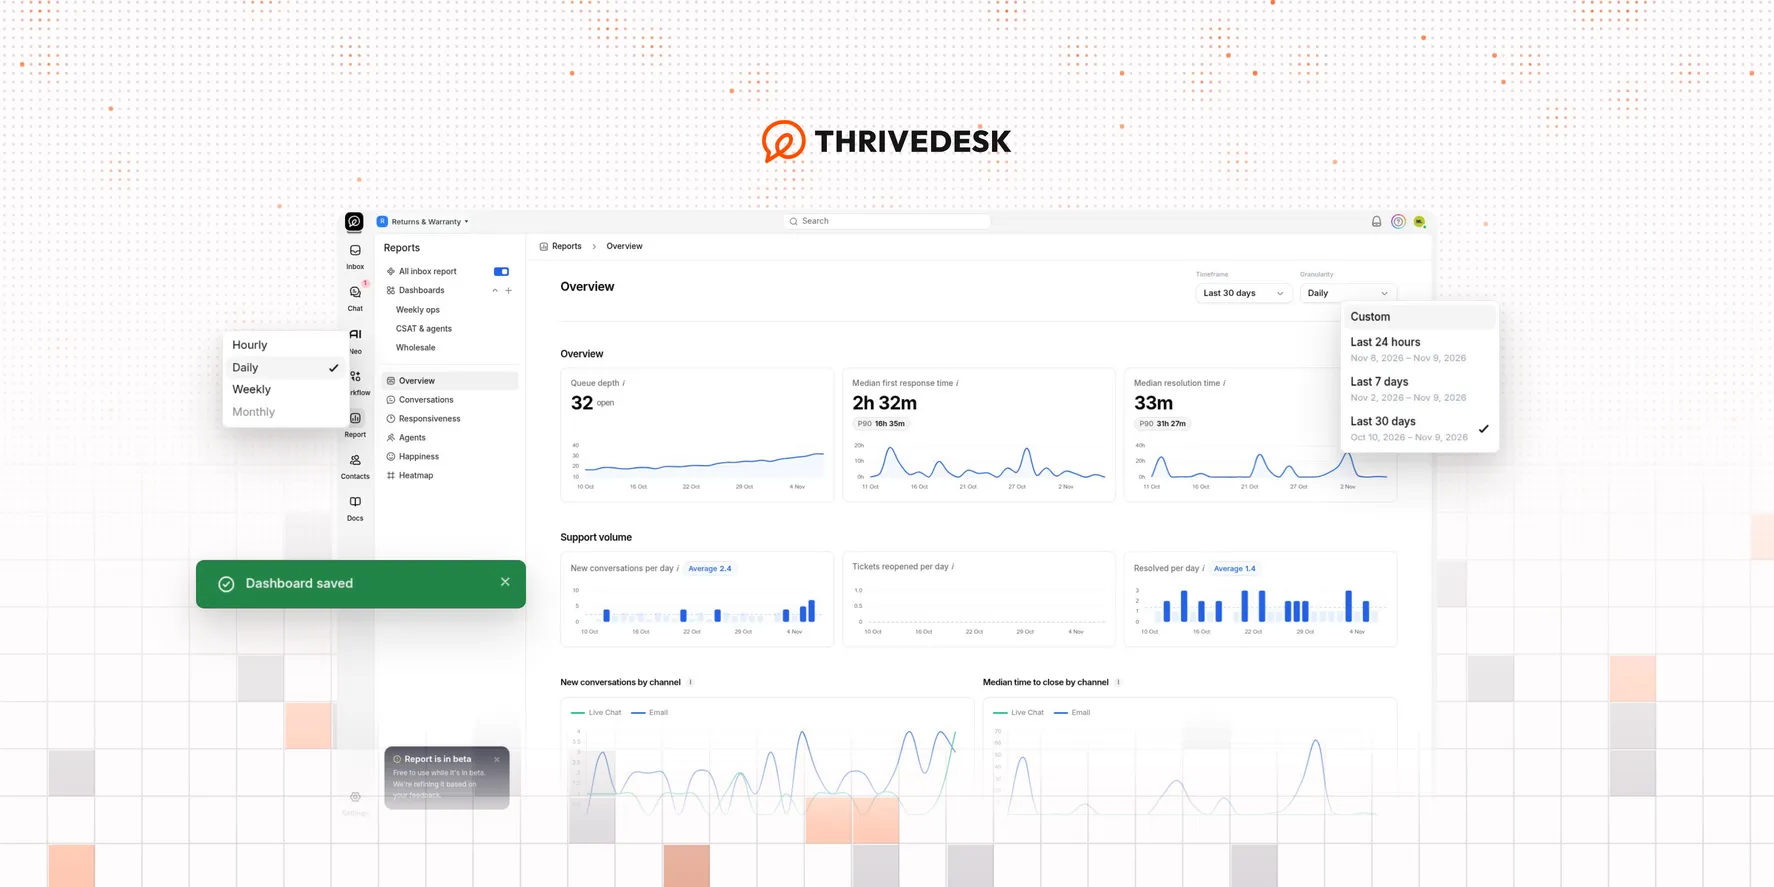
Select Report in the left rail to open Reports. The sidebar has six report pages: Overview, Conversations, Responsiveness, Agents, Happiness, and Heatmap. Your dashboards are in the same sidebar.
Reports is in beta, and it’s free on all plans while it’s in beta. The Account Owner and Administrators can open it by default. Other teammates need the Reports Read capability.
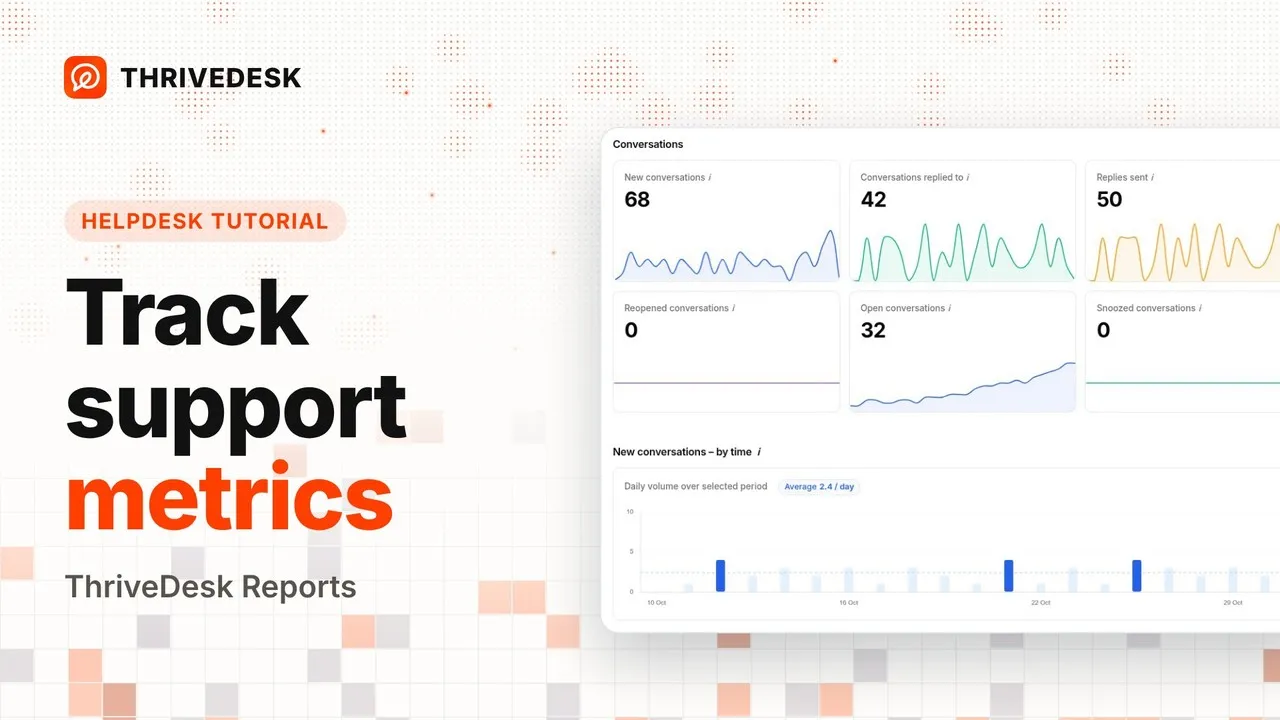
Choose the inboxes and the period
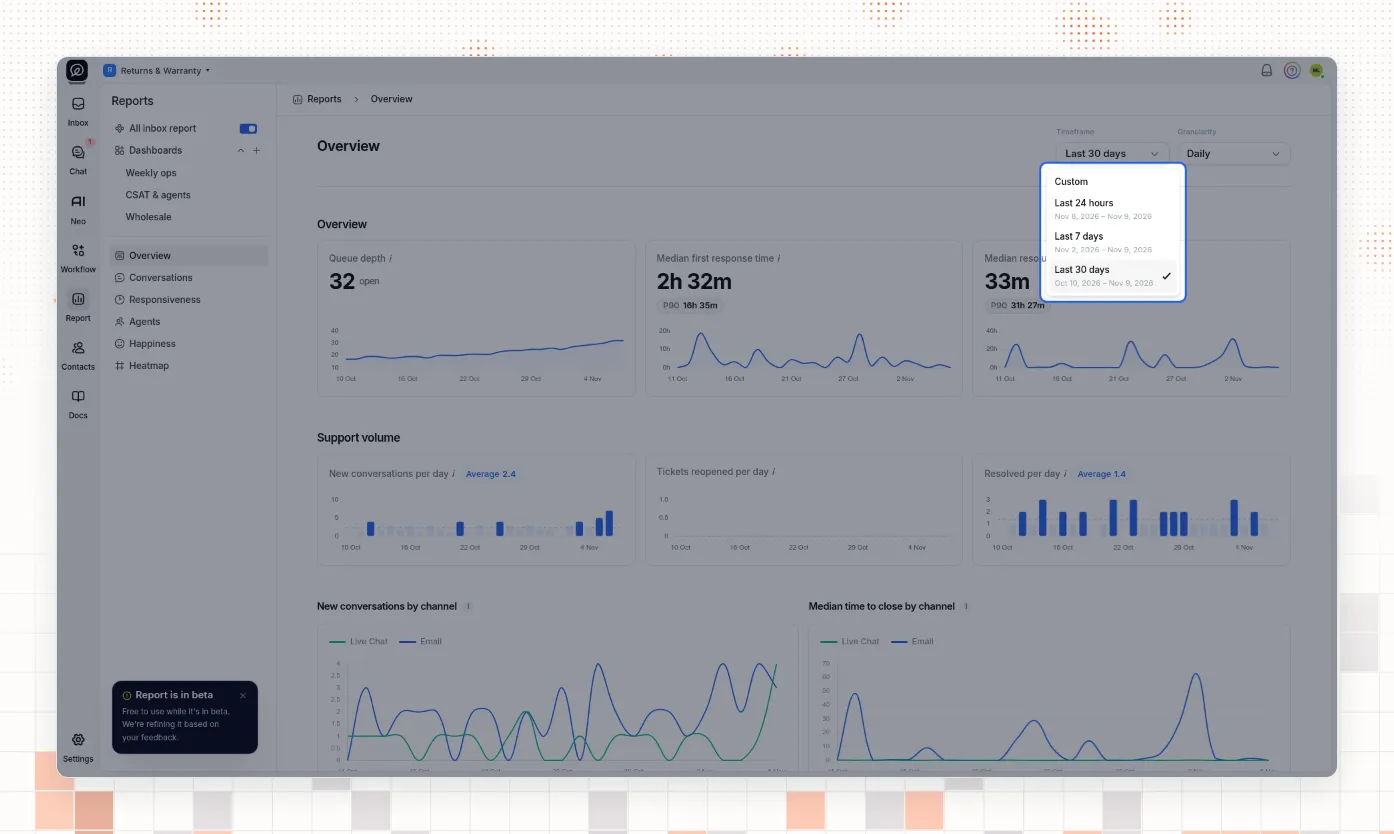
Open Timeframe at the top right of a page and choose Last 24 hours, Last 7 days, Last 30 days, or Custom dates. Last 30 days is the default. Granularity groups the charts by hour, day, week, or month. Your choice stays when you go to another page or open a dashboard.
Reports shows the inbox that is selected at the top left of the screen. To see every inbox, turn on All inbox report. The switch turns off again when you reload the page. The Account Owner sees every inbox. Other teammates see only the inboxes where they are an agent.
Days and hours follow your workspace time zone. Response and close times count every hour, including nights and weekends. Business hours don’t change them.
See the main numbers on one page
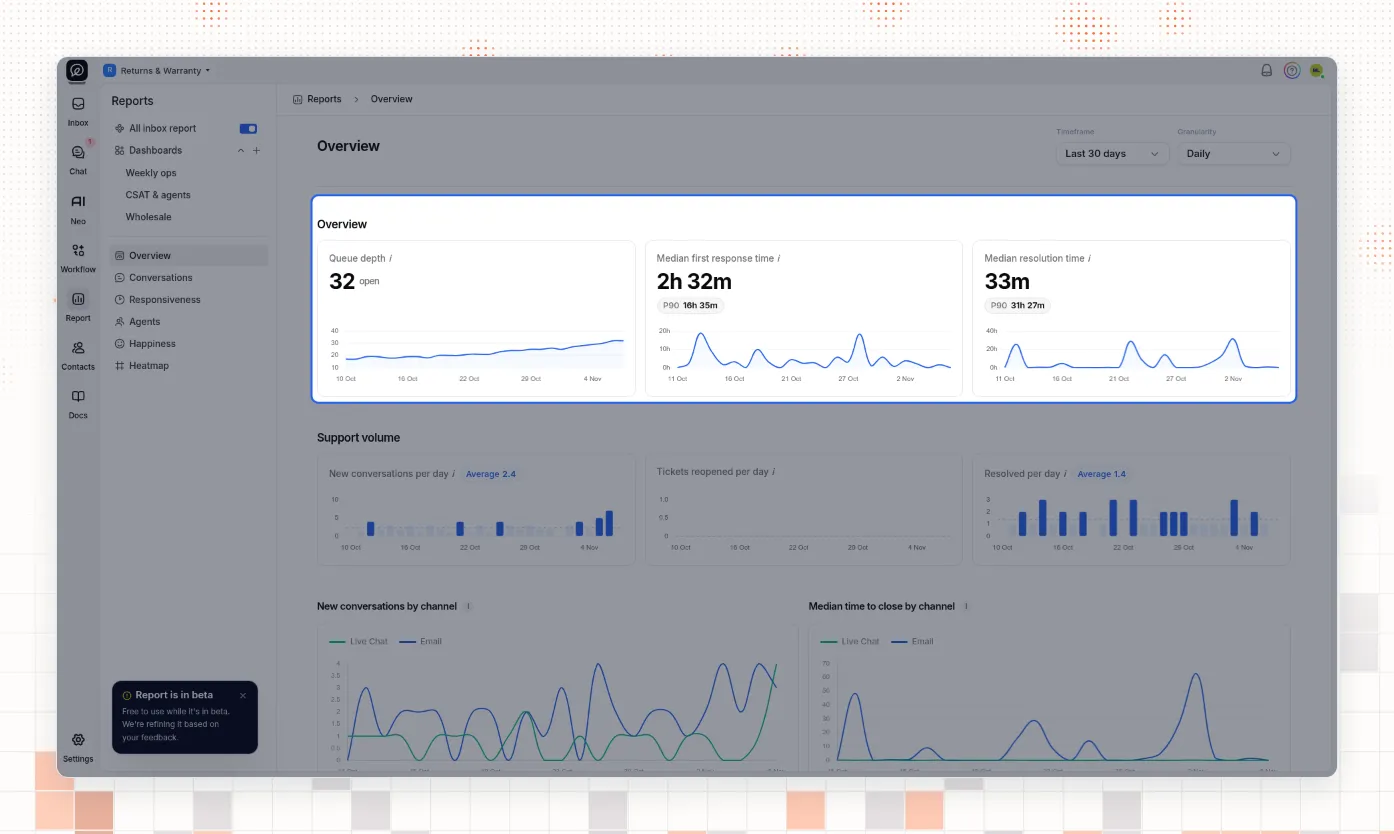
Overview shows your queue depth, median first response time, and median resolution time. Below them are your support volume, the numbers for Email and Chat en vivo, your CSAT score, and the five fastest agents. Each chart has an i icon. Point to it to read how ThriveDesk calculates the number.
Conversations counts the new, replied-to, closed, and reopened conversations in the period. Responsiveness shows median and P90 response, first response, and close times. It also puts each conversation in a time band, such as 10m – 30m or > 1h, so you can see how many replies are slow.
Compare your agents
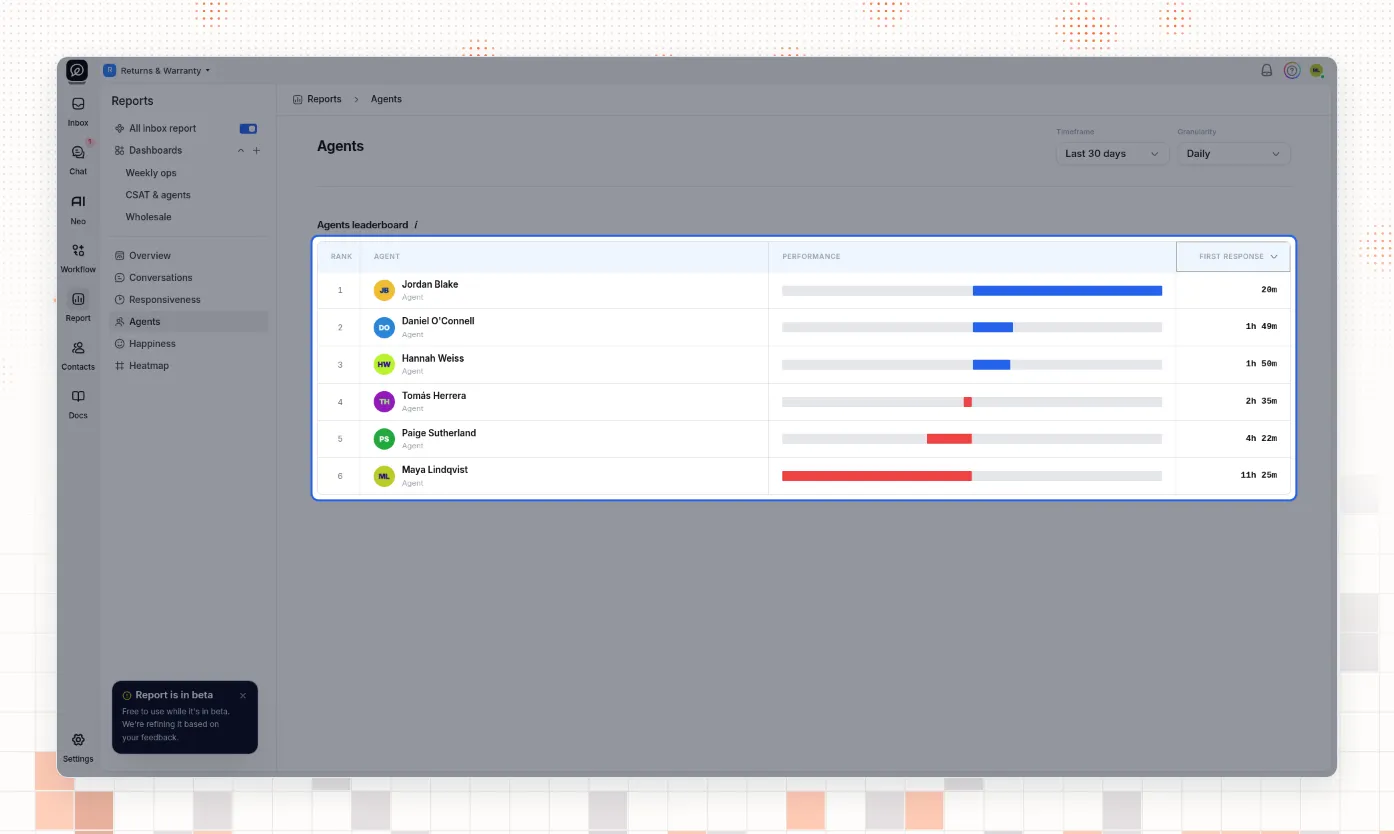
Agents ranks your team by First response, Time to close, or Response time. The fastest agent is at the top. A blue bar means faster than the team median, and a red bar means slower. Select an agent’s name to open their own report: conversations, replies, response and close times, CSAT score, and their recent ratings.
See customer ratings and your busiest hours
Happiness shows your CSAT score, which is the percent of ratings that are great. It splits the ratings into Great, Okay, and Bad, and lists each rating with the agent, the customer, and the conversation.
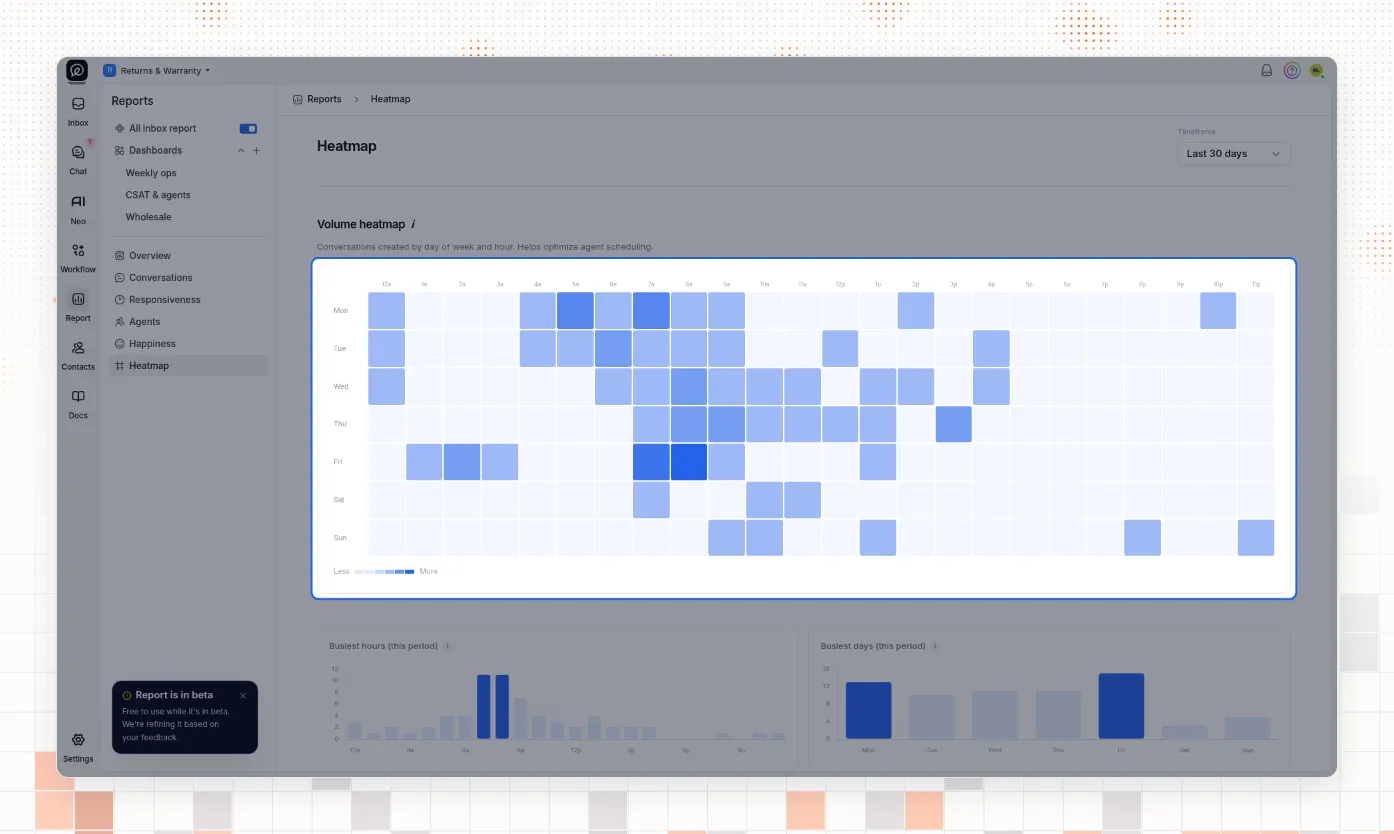
Heatmap shows when new conversations arrive, by day of the week and hour. A darker square means more conversations. Select a square to see the conversations behind it. Use it to plan who works which shift.
Build a dashboard with the charts you need
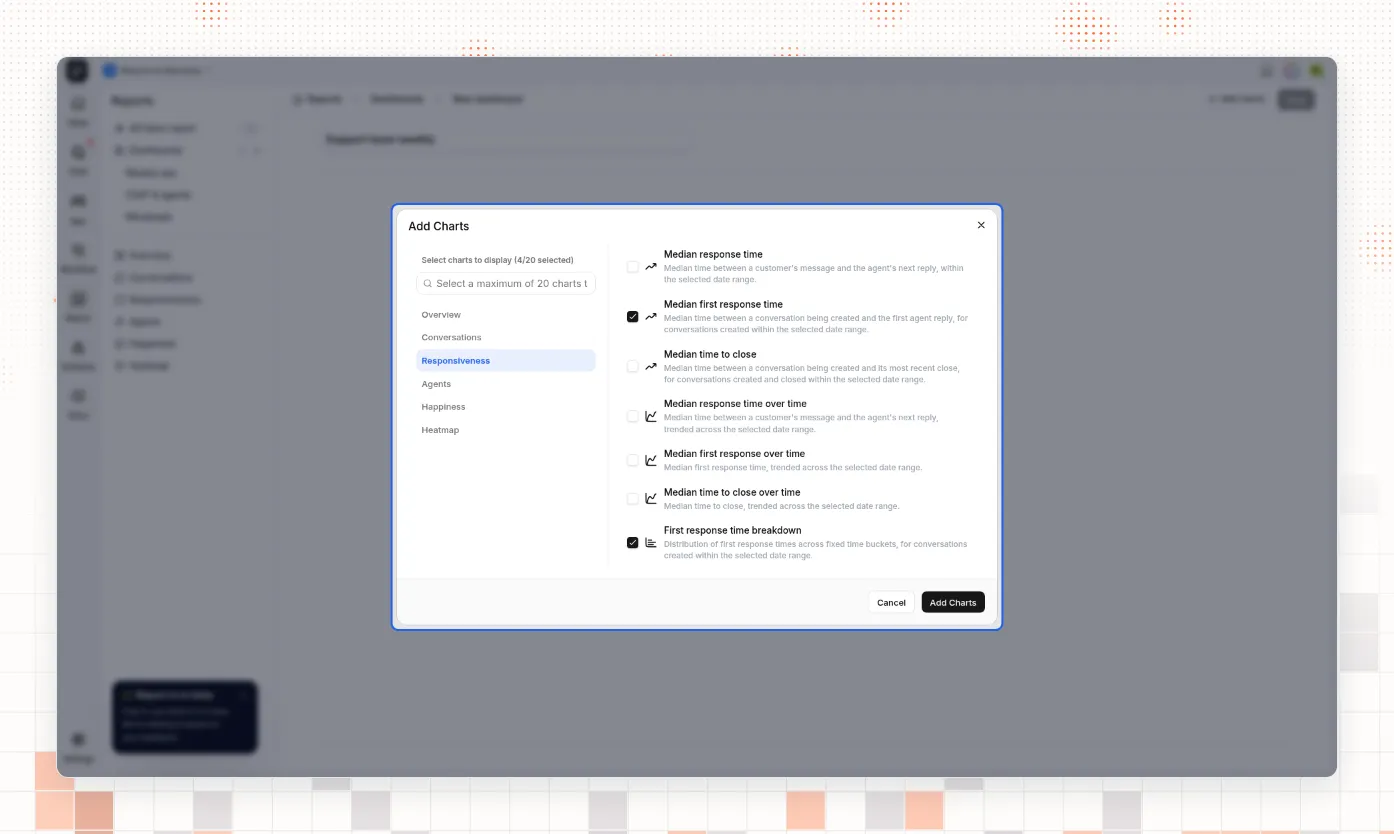
To make a dashboard, select + next to Dashboards in the Reports sidebar. Type a name, select Add charts, and choose charts from any report page. A dashboard holds up to 20 charts. Select Save, and the dashboard shows in the sidebar.
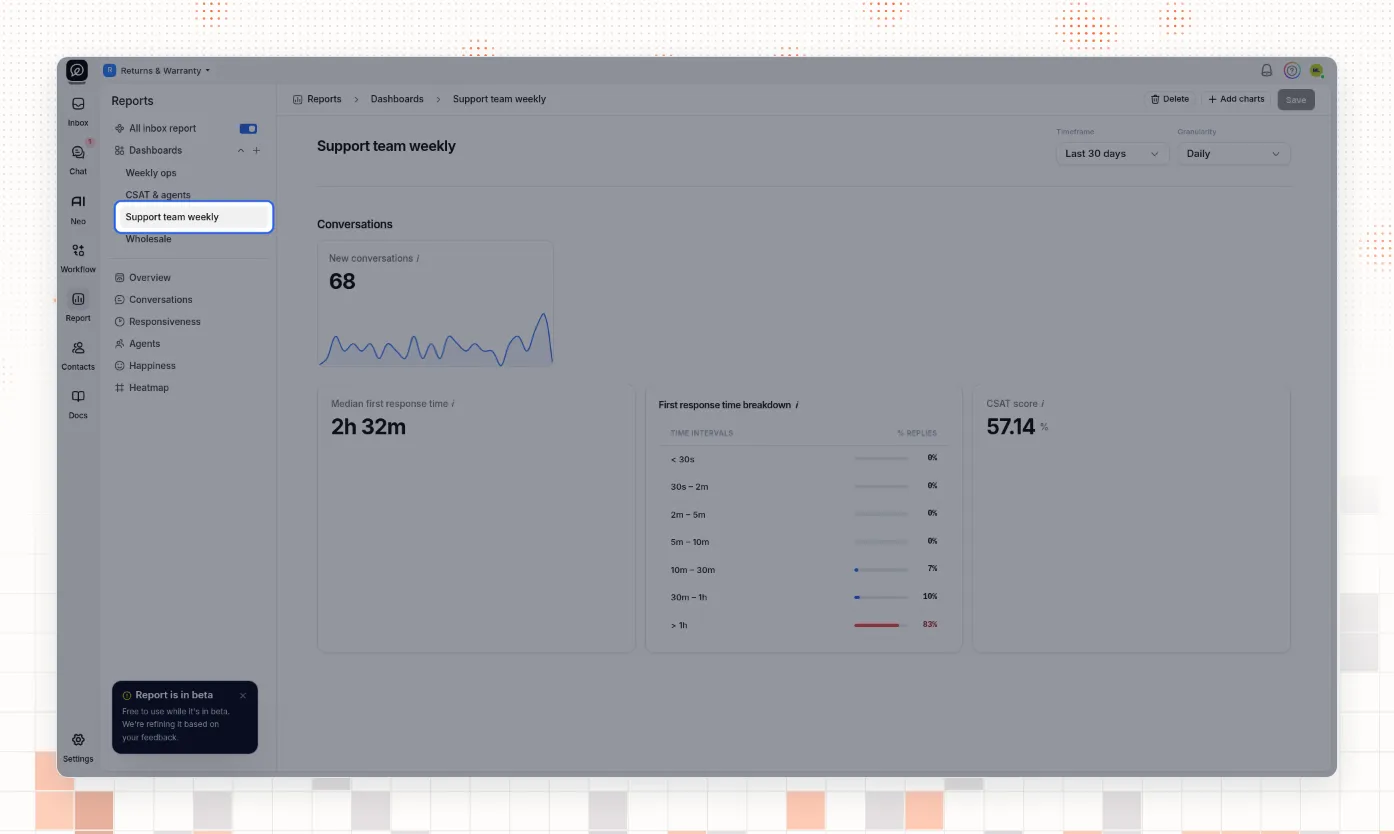
A dashboard uses the timeframe and granularity that are on the screen. It doesn’t keep its own. Only you can see the dashboards you make. To rename a dashboard or change its charts, open it and wait until the charts load, then make the change and select Save. Delete removes a dashboard, and you can’t undo it. Your report pages don’t change.
Leer la documentación